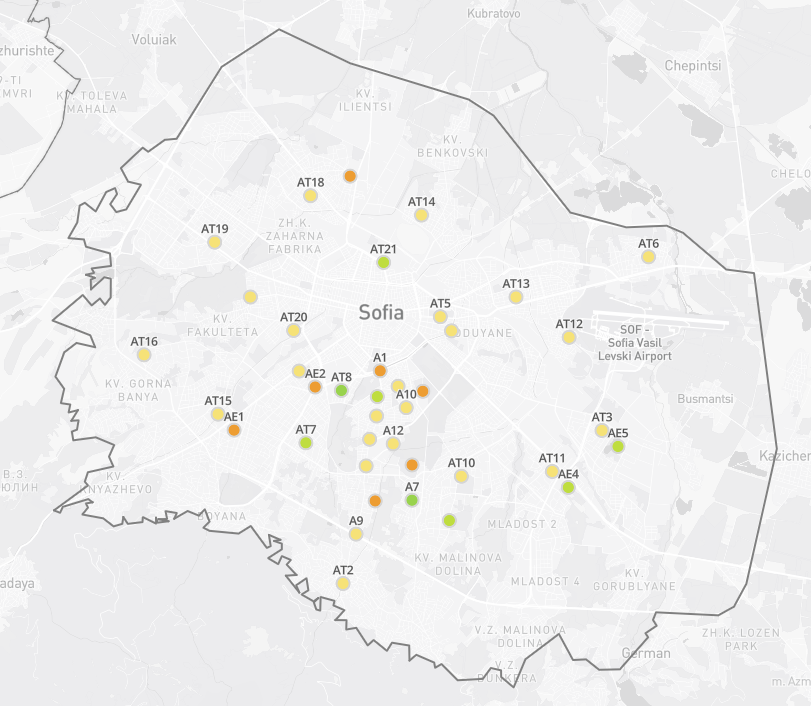
Sofia Sensors leverages Mapbox GL JS for visualizing air quality sensor data across Sofia. Users can toggle visibility of ExEA, AirThings, and GATE City Living Lab layers on an interactive map.
The project allows users to visualize sensor data with charts, select specific sensors, and analyze data over different time intervals.
Sofia Sensors uses an API that provides access to cleaned, structured air quality data and spatial predictions for Sofia. It aggregates data from ExEA, AirThings, and the GATE City Living Lab sensors. Users can retrieve data at varying levels of detail, such as by time, station, or parameter, ensuring flexibility for diverse use cases.
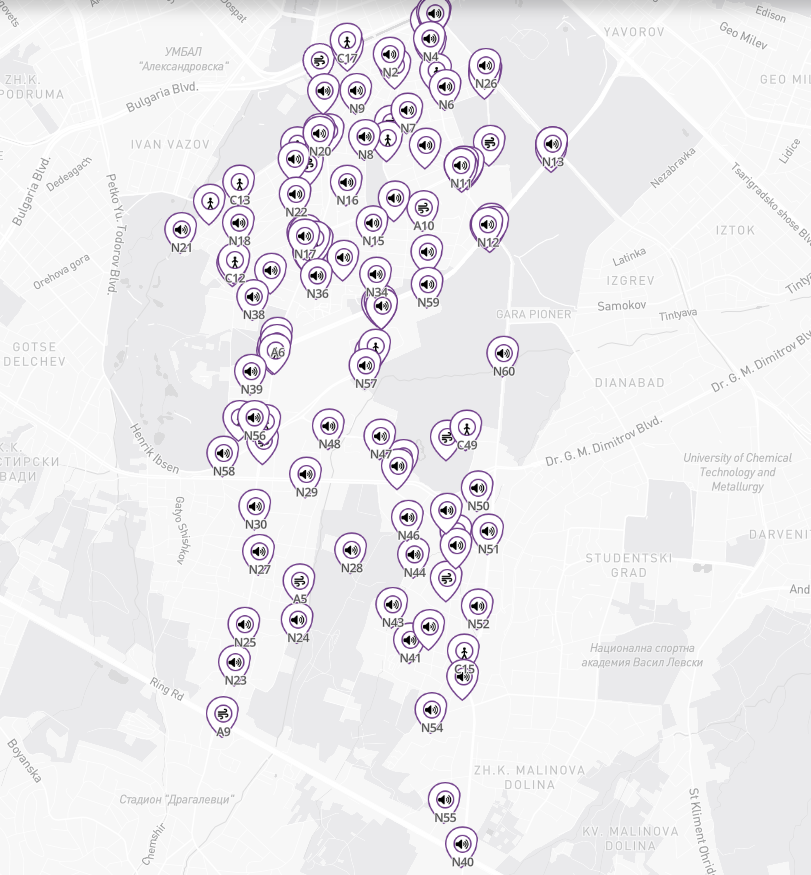
The **GATE City Living Lab Platform** visualizes real-time air quality data, collected from various sensors such as air quality, pedestrian count, and noise across Sofia, displayed on an interactive map. Users can toggle between different sensor layers and explore the data.
Users can select sensor stations to view detailed information such as model, address, and the latest readings for monitored parameters. The platform also offers the ability to toggle sensor types, filter stations, and analyze data through tools such as chart visualizations for different time intervals.
The City Living Lab uses an API to provide access to structured, cleaned data from air quality, noise, and pedestrian sensors. The data is aggregated from the GATE City Living Lab sensors, offering users flexibility to retrieve data by time, station, or parameter.